X-Ray is a tool designed to monitor website performance and detect performance issues.
X-Ray can collect and display information about slow scripts, external queries and website database queries.
To switch to X-Ray, log in to the DirectAdmin hosting control panel and click the X-Ray tab.
X-Ray provides a manual option for monitoring requests to the site:
A manual trace task is a task that can be created for a specific URL to collect queries. The task will finish either after the specified number of requests to the URL, or after a specified amount of time (two days at most).
It is also possible to export the report in PDF format.
The Trace Tasks tab contains a list of all tracing tasks created manually.
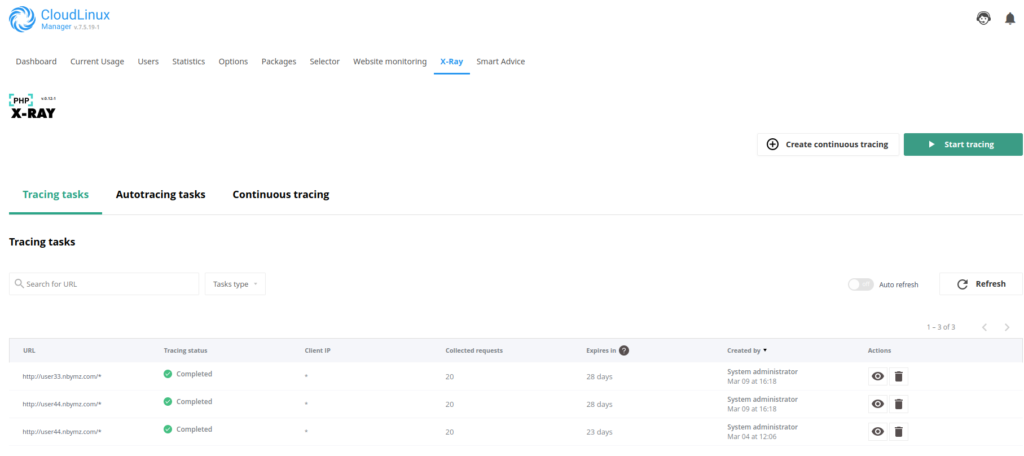
Managing the trace task
- Click the Start tracing button to create a new task.
- In the pop-up window that opens, specify the URL of the website to track.
- Press the Run button.
- Traceroute will work in default mode, tracing the first 20 requests to the specified URL.
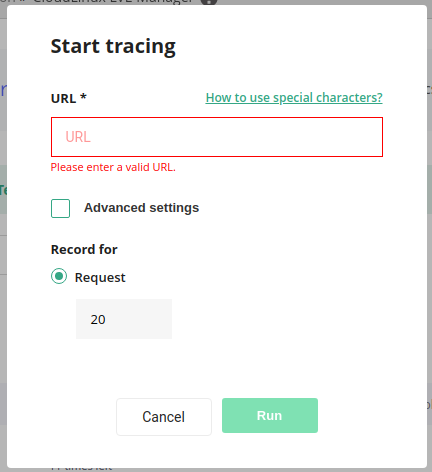
Default settings:
The URL must be a valid URL for the domain that exists on the current server.
Advanced settings allow you to set the IP address and tracking parameters: by time or by number of requests.
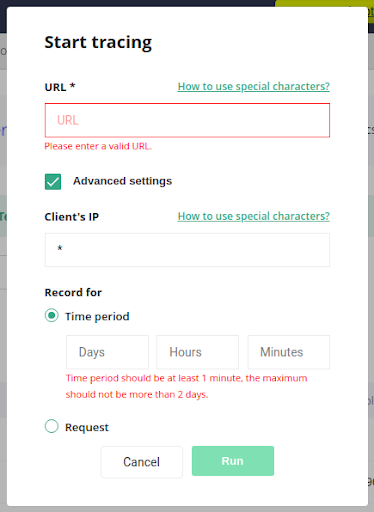
Advanced settings:
- Client IP: This is the IPv4 address of the traceroute client.
For example, if you have a working website that handles requests from different IP addresses and you don’t want to add those requests to the tracking task. Thus, you can specify a specific IP address and X-Ray will analyze requests only from that specific IP address.
- Time period recording: how long X-Ray collects requests (maximum 2 days)
- Queries: the number of queries that X-Ray will collect.
Once created, the task will appear in the task list.

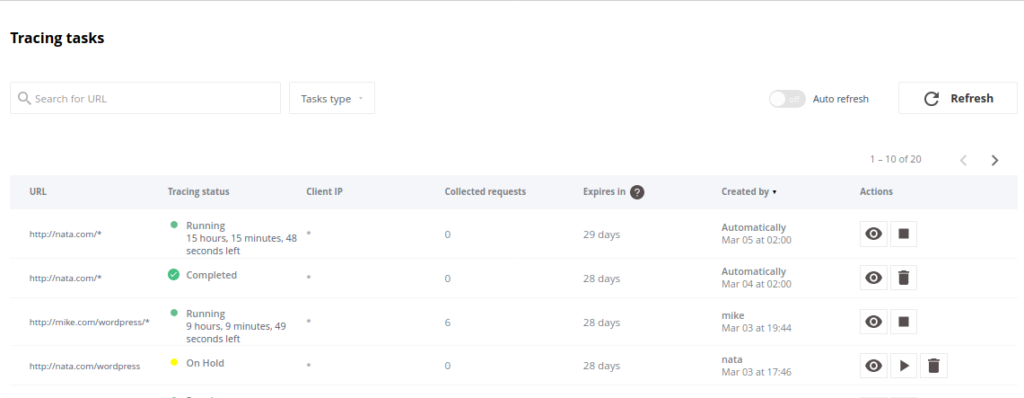
Task Statuses:
- Running – tracing is running.
- Stopped – tracing is stopped manually.
- On hold – this URL already exists in the list. Task processing will not start automatically. You have to run it manually.
- Completed – the period of time completed or the number of requests reached.
Collected information on the task:
Press the eye button to view the collected information.
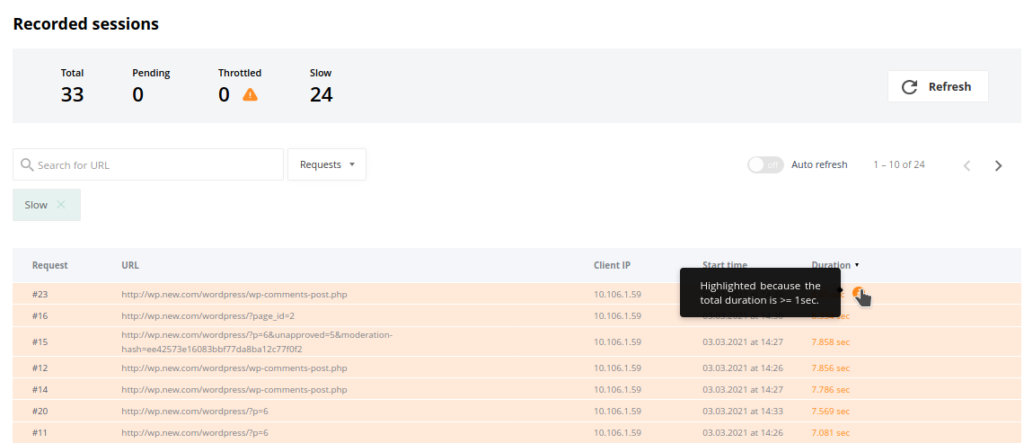
Slow requests will be highlighted.
- Total – shows how many queries were collected according to the task.
- Pending – shows how many of the collected queries are not yet displayed in the table.
- Throttled – displays the number of requests that exceeded LVE limits.
- Slow – displays the number of requests longer than one second.
If slow requests were not detected during the trace, the following is displayed. Here you can also see all the requests.
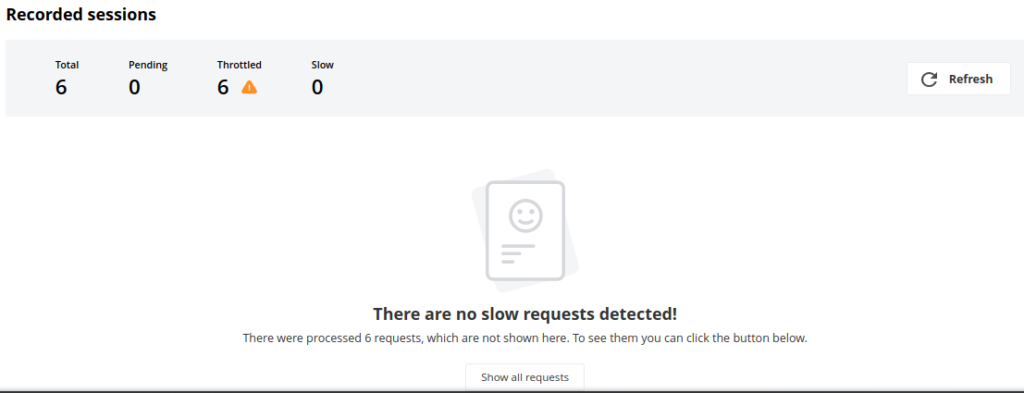
X-Ray collects the following data for each query:
- Top issues – the slowest query items
- Software modules/plugins – modules and plugins by runtime (only for WordPress)
- Database queries – database queries by execution time
- External requests – requests to external resources by execution time
- Other system functions – system functions by execution time
Software modules/plugins – modules and plugins

Database queries – database queries
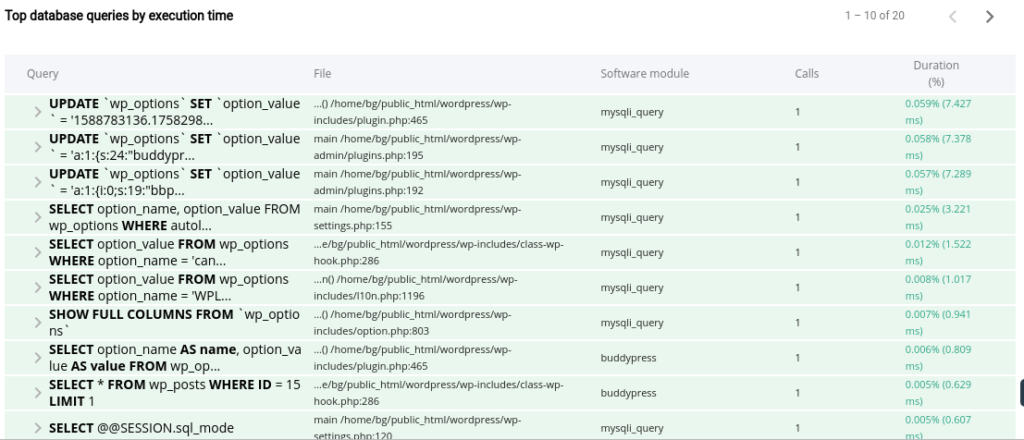
External requests – external requests

System functions – system functions
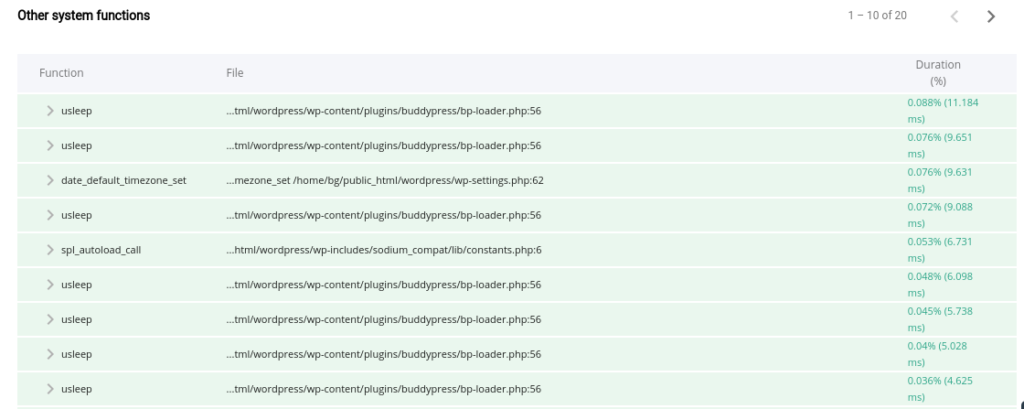
How can I use PHP X-ray to speed up my Wordpress site and find the cause of slowness?
- Specify the URL of the slow site.
- Visit a slow site and do something like leave a comment to make a POST request. This will allow PHP X-Ray to gather information about site performance.
- Go back to the tracing task. You will see the slowest queries at the top of the list.
- Take a look at the information page that shows performance problems. For example, if one of the WordPress plugins uses a lot of resources, you will see this in the table.
- Disable the plugin through the WordPress admin interface.
- Go to the site again and make a few more requests. The site should load faster than before. There should be no performance issues on the details page.
